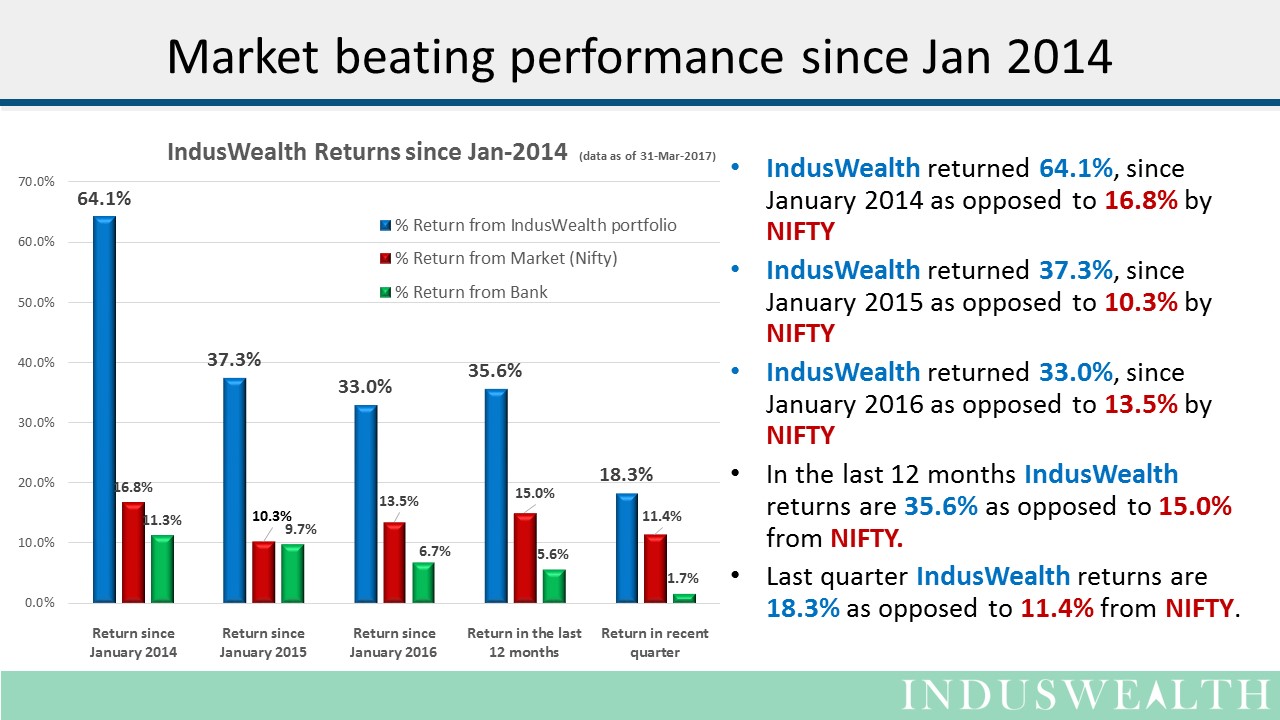
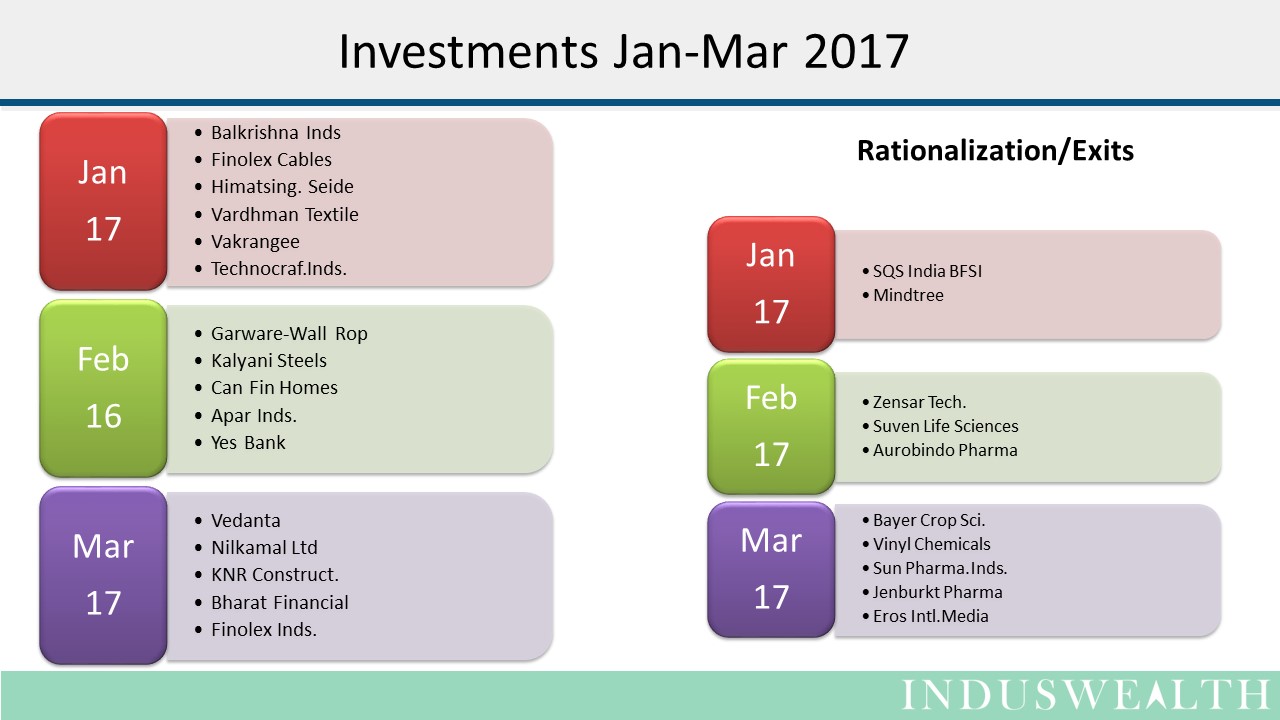
As we end the quarter January -March 2017, we are happy to share the results of IndusWealth model portfolio.
Results for IndusWealth can be downloaded from the links below:
- Summary of the returns
- Portfolio performance summary
- Benchmark return calculations
- Transactions in the model portfolio
- Stock wise returns for the model portfolio
Market Analysis
There was 10% run up in the market last quarter, thus making most investments look good. This run up means there will clamor from various investment firms to say that this is the “best time to invest”.
We are sure that you will hear a lot of this noise, we will try to give you some insights into evaluating various investment options.
One of the key points of evaluating any returns is to have a specific reference. We believe all investments in the equity market should be evaluated against an Index. For a long term buy hold strategy that does not involve leverage – broad market index will be most suitable reference.
The probability of any stock beating the Index is 45%, hence beating the market is not easy. Investing in a low-cost index fund is a reasonable strategy for most investors. The average return for a long-term investor in the index has been about 14% over the last 26 years. This is a very good return.
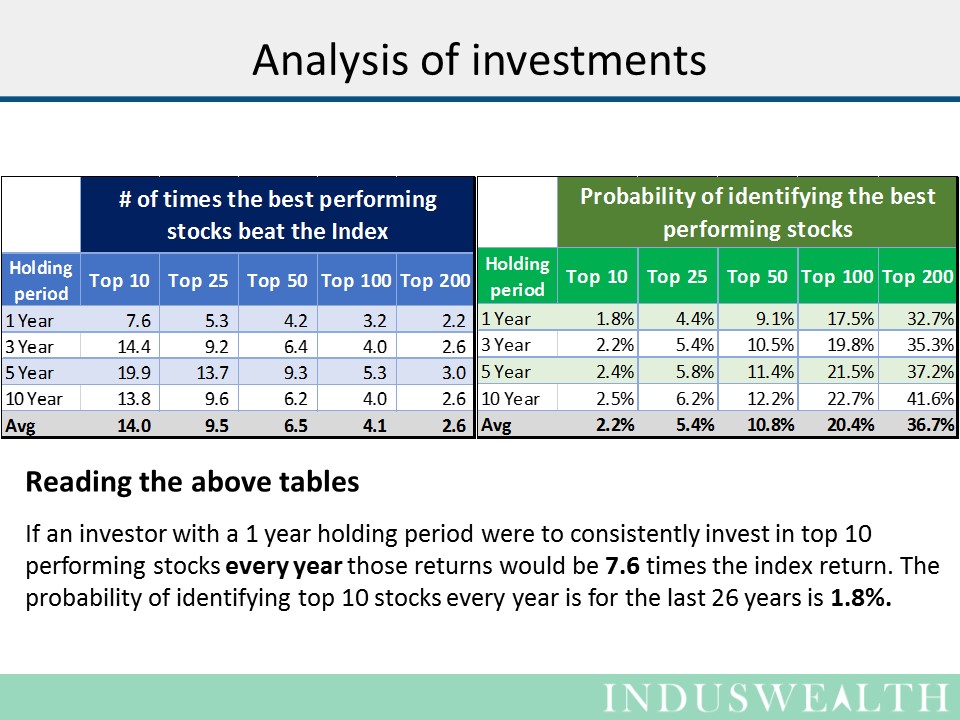
However, investors interested in generating returns better than the index should understand the odds they are facing. We would like to share an analysis we were conducting. Objectives of the analysis were to
- Identify the magnitude of best possible returns one can generate with a buy and hold strategy
- Identify probability of getting those returns.
- This analysis is based on data from 1990 to 2016.
- Holding periods of 1, 3, 5, and 10 years were analyzed
- Identified returns generated by investing in top performing 10, 25, 50, 100, and 200 stocks
- Analyzed the odds of identifying top performing 10, 25, 50, 100, and 200 stocks.
Key inferences form the analysis
- Longer holding periods tend to generate better returns and the odds of finding outperforming stocks are also higher for longer holding periods.
- 5 year holding period seems to be give an overall better return. Reason could be that it is very difficult for any stock to consistently be in the top few outperformers for 10 years.
- Odds of beating the market by over 2 times is about 36%. Even the best performing mutual funds don’t seem to do this over a long period. Most mutual funds lose to the Index.
In the light of this research let’s look at the returns generated by IndusWealth.
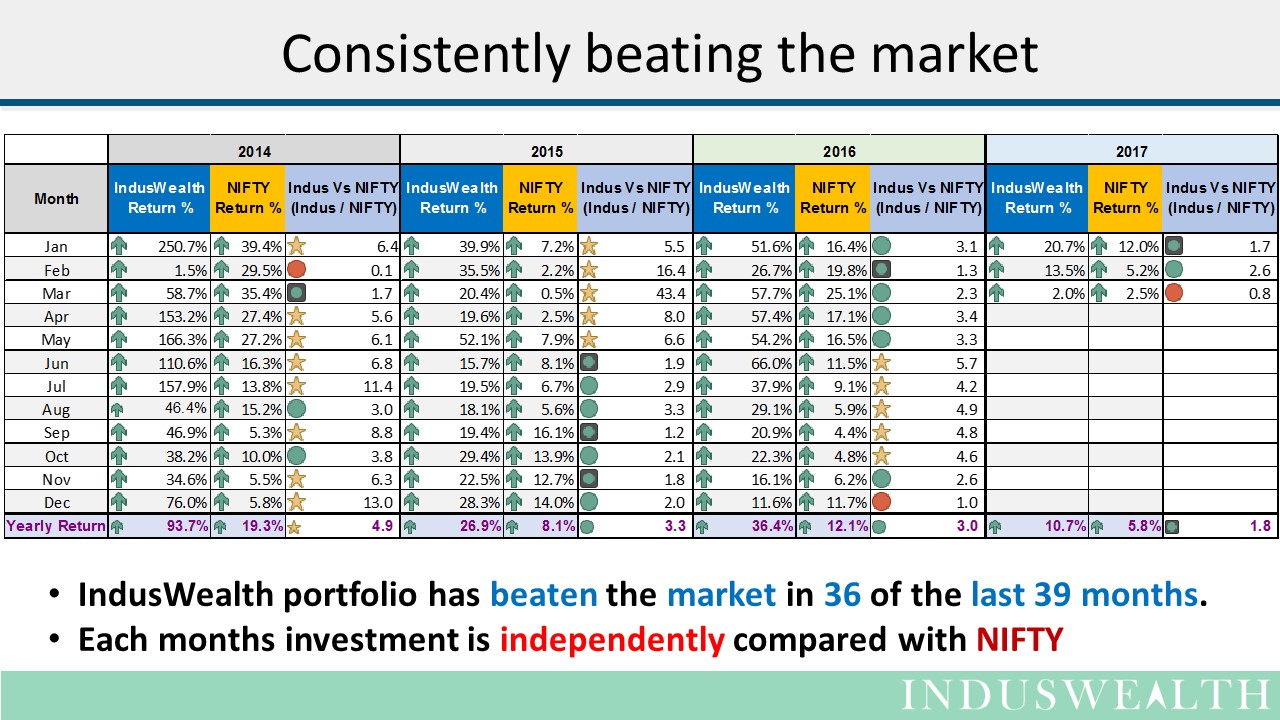
Monthly investments are being independently tracked vis a vis the market.
- IndusWealth investments have beaten NIFTY in 36 of the last 39 months.
- IndusWealth portfolio has generated 4 times NIFTY returns since 2014. Based on the analysis the probability of this is 20%.
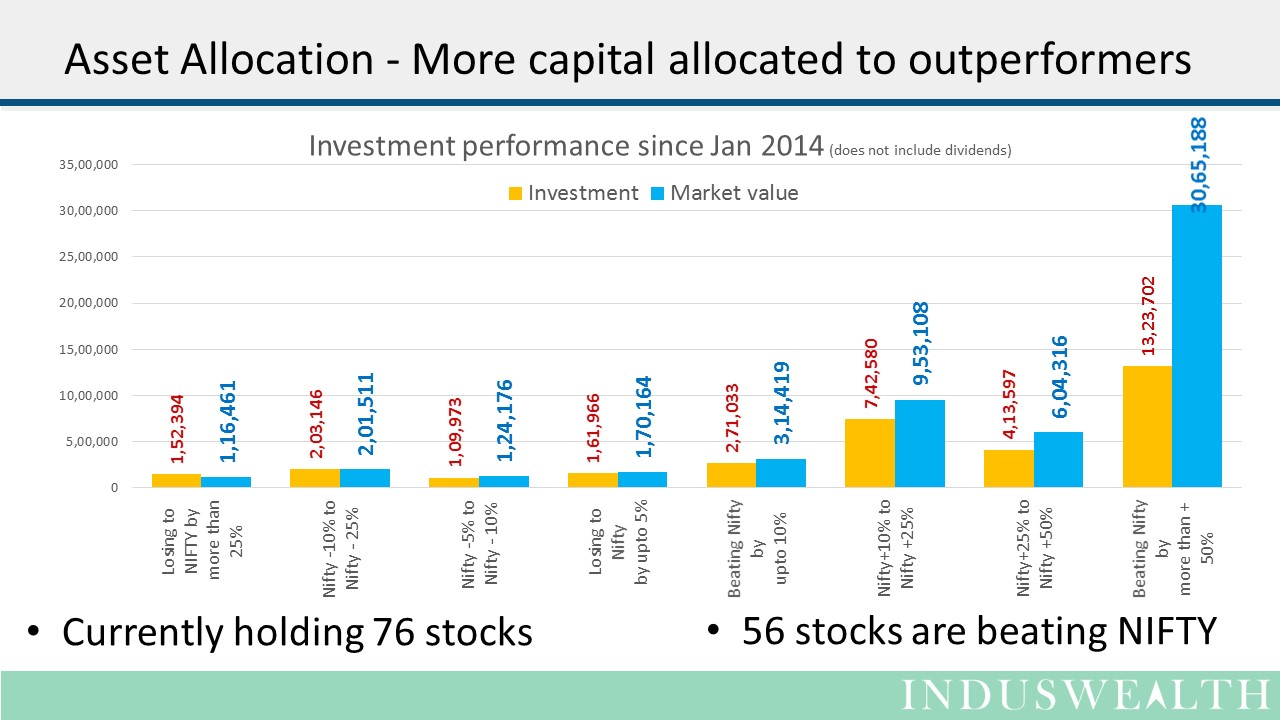
- Older investments tend to do better as the tend to compound at a higher rate than Index.
On the other hand, the small cap portfolio started by IndusWealth in Jan 2017, has been trailing the market for the last 3 months. Although, while launching the portfolio we stated that 24 months is the right time frame to evaluate a small cap portfolio; this example is being presented to make a statement that investing has a lot of uncertainty. A process that works for one portfolio does not necessarily translate into others.
In conclusion, the things to remember when evaluating investment options
- Odds are stacked against investment success, beating the index is tough.
- When odds are not in favour, robust investment process is the key for favourable outcomes
- A robust investment process does not guarantee success as there is a large element of chance.
- One should use the market performance as a benchmark to evaluate outcomes.
I hope this gives you some tools to evaluate investment options you are considering.
Happy Investing….
