
We wanted discuss the odds of making money in the stock market for investors. We analyzed data of all 2095 companies that had a market cap of over 50 crores on 31st December 2016. The data goes back 26 years – starting from 1991.
Analysis of daily performance of SENSEX over the 26 years
- Out of a total of 6,321 trading days there were 3,334 days when the return was positive, i.e., 52.7% of trading days showed positive returns.
- The average daily return was 0.065%. This might not seem significant but it translates to 16% yearly return, which is a very good return by any measure.
About 53% of the trading days gives a positive return, this means investing in the markets is favorable for the investors.
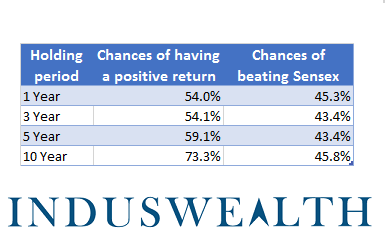
There is a lot of research available that favors “buy and hold strategy”. We looked at various holding periods to review the odds.
Observations from this analysis:
- Holding period of 1 year has a 54% chance of making a profit and 45% chance of beating SENSEX
- Holding period of 5 years has about 59% chance of making a profit and 44% chance of beating SENSEX.
- Holding period of 10 years has about 73% chance if making a profit and 46% chance of beating SENSEX.
It is important to note that 10 year holding period will have a bit of survivor ship bias, i.e., only companies that survived for 10 years will be included in the analysis.
We can safely conclude that an investor ready to hold for more than 1 year has a good chance of making a profit.
This also means that odds don’t favor an average investor in beating SENSEX.
This makes buying low cost index funds a reasonable strategy for an average investor.
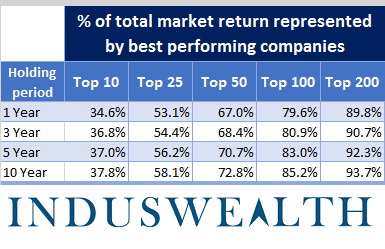
For direct equity investors, we looked at the percentage of total market returns represented by the best performing stocks.
Observations from the analysis
Across various holding periods
- Top 10 best performing stocks represent about one third of the total market returns.
- Top 25 best performing stocks represent half the total market returns
- Top 50 best performing stocks represent two thirds of the total market returns
- Top 100 best performing stocks represent 80% of the total market returns
This analysis clearly shows that 80% of the profits are attributable to top 100 stocks.
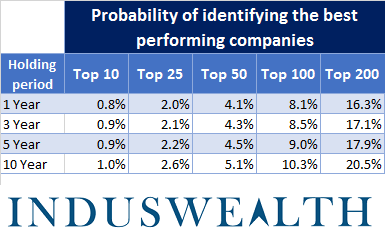
Let’s look at the odds of finding the best performing stocks.
Observations from the analysis
- Chance of identifying the top 10 stocks is less than 1%
- Chance of identifying the top 20 stocks is less than 2.5%
- Chance of identifying the top 50 stocks is less than 5%
- Chance of identifying the top 100 stocks is less than 10%
80% of the market returns can be attributed to top 10% of the stocks.
Although about 55% of the stocks make a profit – the top 20% of the stocks capture almost all the market returns.
Key points for individuals investing directly in equities
- Odds of finding stocks that will do well are low (less than 10%)
- A robust investment framework and process in required to consistently beat the market
In summary:
- Odds favor long terms investors (53% chance of making a profit), investors with long term horizon should consider investing in stock markets.
- Average investor should look to invest in the Index using a low-cost Index fund.
- Direct equity investors should understand that the odds are stacked against them. They need to have a robust investment framework and process to make their investment decisions.
We hope this blog assists you in getting a better understanding of investment odds and making better decisions
Happy Investing….