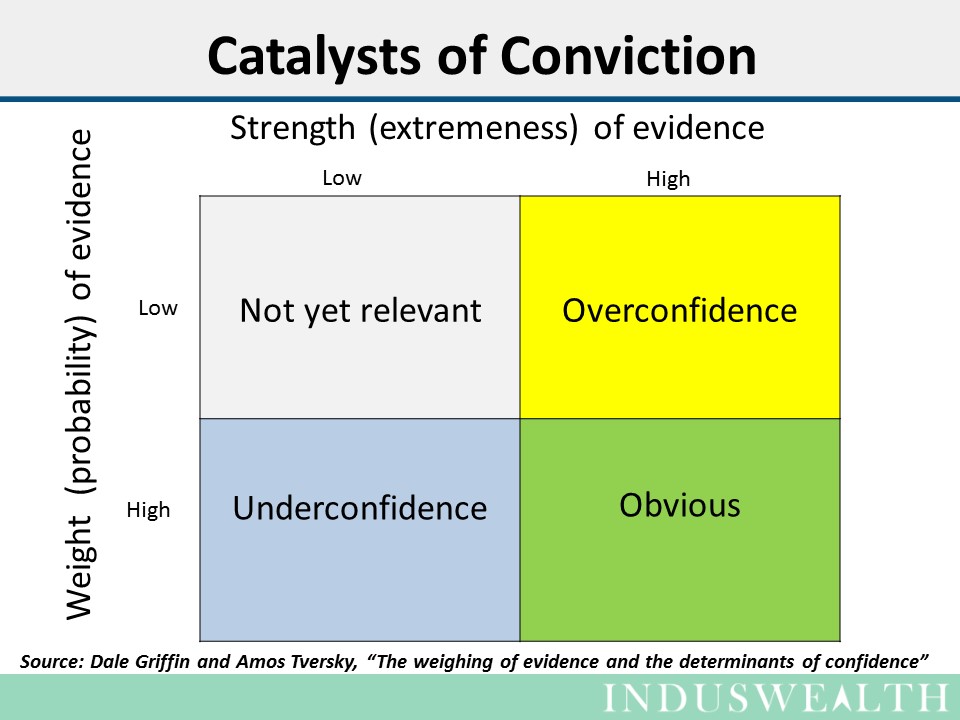
Dale Griffin and Amos Tversky – in a very interesting paper, ‘ The Weighing of Evidence and the Determinants of Confidence’ – state that intuitive judgment is explained by the hypothesis that people focus on the strength or intensity of available evidence with insufficient regard for its weight or importance.
For instance, many believe that travelling by air is more dangerous than travelling by road. This could be explained by the greater focus on the strength of the evidence as air disasters get more visibility than car accidents do. They tend to overlook the weight or probability of the occurrence as air accidents are less frequent than road accidents.
Our beliefs are more often than not based on evidence. There are two aspects of evidence that impact them.
- Strength of evidence or how a case is presented (coverage by media, information from a trusted source etc.). To evaluate the strength of evidence one should differentiate between news (facts) and views (opinions).
- Weight of evidence or how often the event has occurred and its chances of recurrence. To evaluate the weight of evidence, one should consider the underlying data and understand the probabilities it represents.
Therefore, one should be able weigh both, strength of the evidence as well as its weight to make good decisions.
From an investor’s perspective:
Overconfidence based on the strength of the evidence while ignoring its weights could lead to taking more risks than justified. For instance, taking stock tips from “punters” who make a compelling case (strength of evidence) without scrutinizing their success rate (weight of the evidence) could lead to making poor investment choices.
On the other hand, ignoring statistically significant evidence (weight of the evidence) due to lack of significant coverage (strength of evidence) could lead to missed opportunities.
An analysis of daily stock returns in NSE since Jan-1991, shows that out of a total of 6,321 trading days there were 3,334 days when the return was positive, i.e., 52.7% of trading days showed positive returns. The average daily return was 0.065%. This might not seem significant but it translates to 16% yearly return, which is a very good return by any measure.
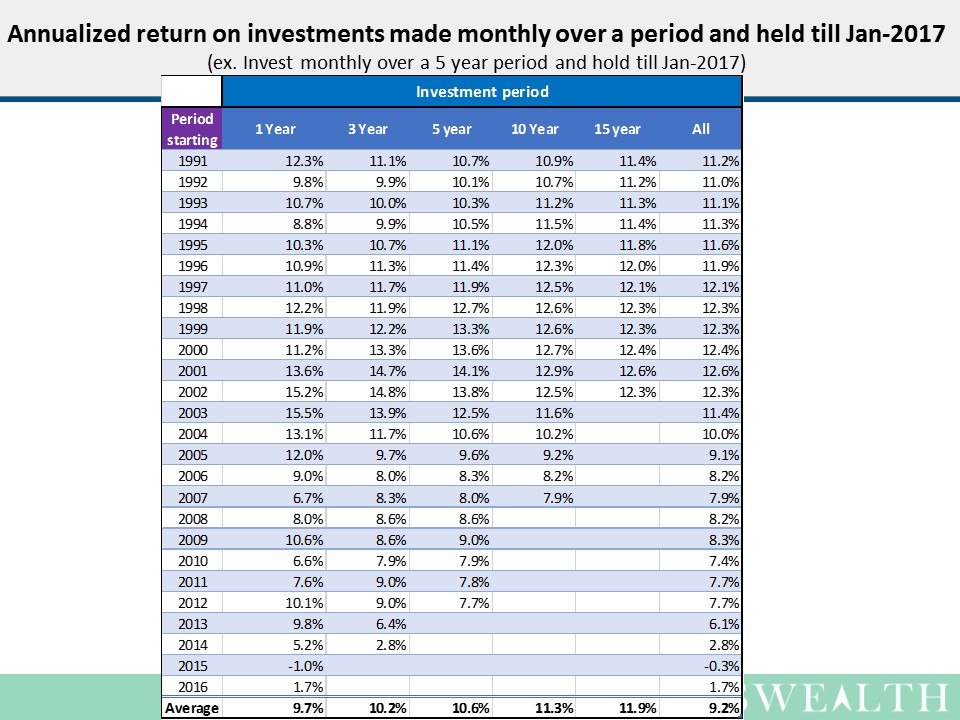
As purchasing daily is not practical, we looked at scenarios where investments were made in NIFTY on the first business day of the month. We studied the returns generated on investments held till Jan-2017.
Investments made in NIFTY over a period of three years from 1991 and held till January 2017 would have fetched a yearly return of 11.1%.
Observations inferred from the analysis:
- If one had invested in NIFTY over any 12-month period and held till Jan-2017, one would have had a positive return for all the years except in 2015.
- Investing for just 12 months even in 2008 when there was a significant market correction, and holding till Jan-2017 has delivered positive returns.
- Investing in NIFTY over any 3-year period since 1991 and holding till Jan-2017 will give a positive return.
- Average return generated by investing in NIFTY over any 5-year period since 1991 and holding till Jan-2017 will be 10.6%, and for a 15-year investment period it will be 11.9%.
Conclusions we can draw from this analysis:
- ‘Buy and hold ‘is an effective strategy.
- The longer the investment duration, the better are the returns.
Newspapers and television channels only discuss significant fluctuations in the market. As a result, many people avoid investing in equities as they believe that the strength of evidence suggests that investing in equities is risky.
In addition, they do not report on the slow process of wealth creation in the market, so the strength of the evidence is low. But businesses have generated a lot of wealth and it is reflected in the steady increase in market capitalization, so the weight of the evidence is high.
Investors would be served well by gaining insights into how the strength and weight of evidence affect their beliefs and decision making.
Happy Investing….

