Small caps attract significant attention, especially in growth markets. Some say they are very risky, some say they are highly attractive investment opportunities for long term investors. Viktan was publishing an edition with a special focus on small cap stocks and reached out to us for our take on investing in small cap companies. We decided to let the data speak.
Definition of small, mid, and large cap is not standardized, definitions we used for this analysis:
For this analysis we assumed that the objective of investing is to beat the market average. We used Sensex as the market average and grouped companies into groups that beat Sensex and those that did not.
Here is a quick snapshot of the data – we will be looking at individual elements in a bit of detail.
Year 2000:
- There were 1023 companies that were listed in 2000 that continue to exist in 2015.
- In the 1023 companies, there were 940 small cap, 61 mid cap, and 22 large cap companies.
- Market capitalization of small cap companies was 86,885 crores in 2000 and their market cap in 2015 was 2,234,446 core – a 25.7 times increase.
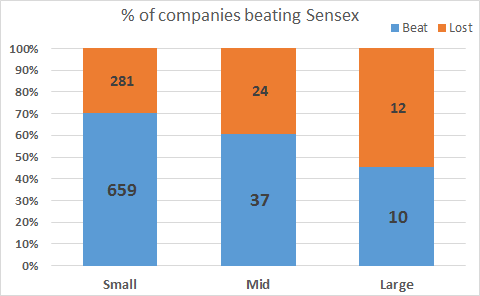
- If we consider the number of companies that beat Sensex returns from 2000 to 2015, 70% of small caps (659 of 940) beat Sensex as opposed to 60% of midcap (37 of 61) and only 45% of large cap (10 of 22)
- Small cap companies that beat the index had a 44.5x increase in their market cap, as opposed to 20.6 times in midcap and 14.1 times in large cap.
- Of the 659 small cap companies in 2000 that beat Sensex return
- 409 remained small cap till 2015, they grew about 19.5 times in this period
- 157 of them became midcap companies by 2015, they grew 28.5 times in this period
- 93 of them became large cap companies by 2015, they grew 57 times in this period.
- Of the 61 midcap companies 37 beat Sensex returns upto 2015, they became Large cap companies in 2015 with 20.6x increase in their market capitalization.
Year 2005:
- There were 1210 companies that were listed in 2005 that continue to exist in 2015.
- In 1210 companies there were 1011 small cap, 136 mid cap, and 63 large cap companies.
- Market capitalization of small cap companies was 172,211 crores in 2005 and their market cap in 2015 was 1,137,441 core and 6.6 times increase.
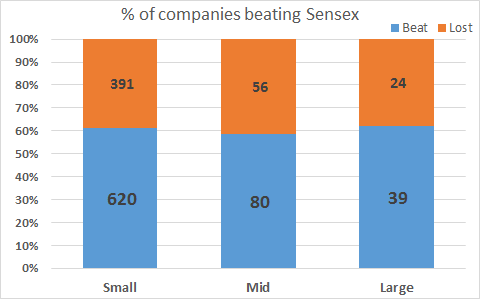
- If we consider the number of companies that beat Sensex returns from 2005 to 2015, 61% of small caps (620 of 1011) beat Sensex as opposed to 59% of midcap (80 of 136) and 62% of large cap (39 of 63)
- Small companies that beat the index had an 11.8x increase in their market cap, as opposed to 10.2 times in midcap and 6.3 times in large cap.
- Of the 620 small cap companies in 2005 that beat Sensex return
- 418 remained small cap till 2015, they grew about 6.76 times in this period
- 154 of them became midcap companies by 2015, they grew 7.7 times in this period
- 48 of them became large cap companies by 2015, they grew 23.6 times in this period.
- Of the 136 midcap companies in 2005, 80 beat Sensex returns upto 2015,
- 9 remained mid cap till 2015, they grew about 3.4 times in this period
- 71 of them became large cap companies by 2015, they grew 10.74 times in this period
Year 2010:
- There were 1532 companies that were listed in 2010 that continue to exist in 2015.
- In 1532 companies there were 1096 small cap, 272 mid cap, and 164 large cap companies.
- Market capitalization of small cap companies was 247,317 crores in 2005 and their market cap in 2015 was 636,207 core and 2.6 times increase.
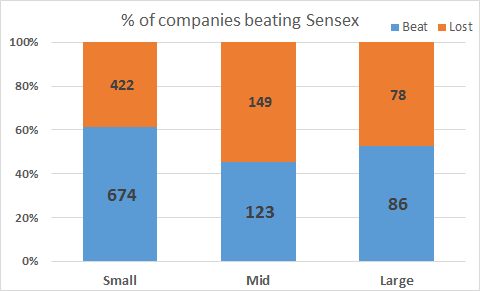
- If we consider the number of companies that beat Sensex returns from 2010 to 2015, 61% of small caps (674 of 1096) beat Sensex as opposed to 45% of midcap (123 of 272) and 52.4% of large cap (86 of 164)
- Small companies that beat the index had a 4.4x increase in their market cap, as opposed to 3.3 times in midcap and 2.4 times in large cap.
- Of the 674 small cap companies in 2010 that beat Sensex return
- 513 remained small cap till 2015, they grew about 2.74 times in this period
- 147 of them became midcap companies by 2015, they grew 4.5 times in this period
- 14 of them became large cap companies by 2015, they grew 14.6 times in this period.
- Of the 272 midcap companies in 2010, 123 beat Sensex returns upto 2015,
- 41 remained mid cap till 2015, they grew about 2.1 times in this period
- 82 of them became large cap companies by 2015, they grew 3.6 times in this period
Based on the data we can see that:
- Small caps represent over 70% of the listed stocks
- Small caps can experience significant growth for a prolonged time period as they start with a low base.
- Small caps as a group have done much better than the market average (SENSEX) if one stays invested for a long time (this analysis is looking at 15, 10 and 5 year time frames)
- More than 50% of the small cap stocks are beating the Index on a long term basis, as there are a large number of stocks it could be a challenge to identify the right ones.
We also know that:
- Small caps can experience significant volatility
- Small caps with a very low market cap can experience significant fluctuation if some large investors buy or sell that stock
- Small caps are can be significantly impacted by change in the competitive landscape and are more prone to be exposed to “key person” risk as some of them may be significantly dependent on a few key individuals
- Small caps are not well tracked by the market research hence there could be significant information asymmetry
Based on this analysis investors should:
- Consider investing in small caps only if their investment horizon is very long (at least 5 years)
- Consider investing in small caps through index funds – that allows one to get exposure to the sector average and minimizes the risk of incorrect selection of stock
- Investors who are considering direct stock investment, should do their research and can look to build their positions over a period of time.
Happy investing….


