Volatility is an inherent feature of the stock market.
This is an analysis of the market fluctuation experienced by various companies. This analysis is to set present the amount of price fluctuation that various companies have experienced over the last 18 years.
Data about data:
- Data used for this is from 01 Jan 2000 to 21 Sept 2018.
- This is an analysis of the monthly percentage change in the stock price of each company from and comparing it with the percentage change in the Index for the same period.
- Companies have been classified into various categories based on their average of market capitalization of all the companies.
- “A” is the average of market capitalization of all the companies on 21 Sep 2018.
- A-3A is the group of companies that have market capitalization between average and 3 times the average.
- GT25A is all the companies that have market capitalization more than 25 times the average.
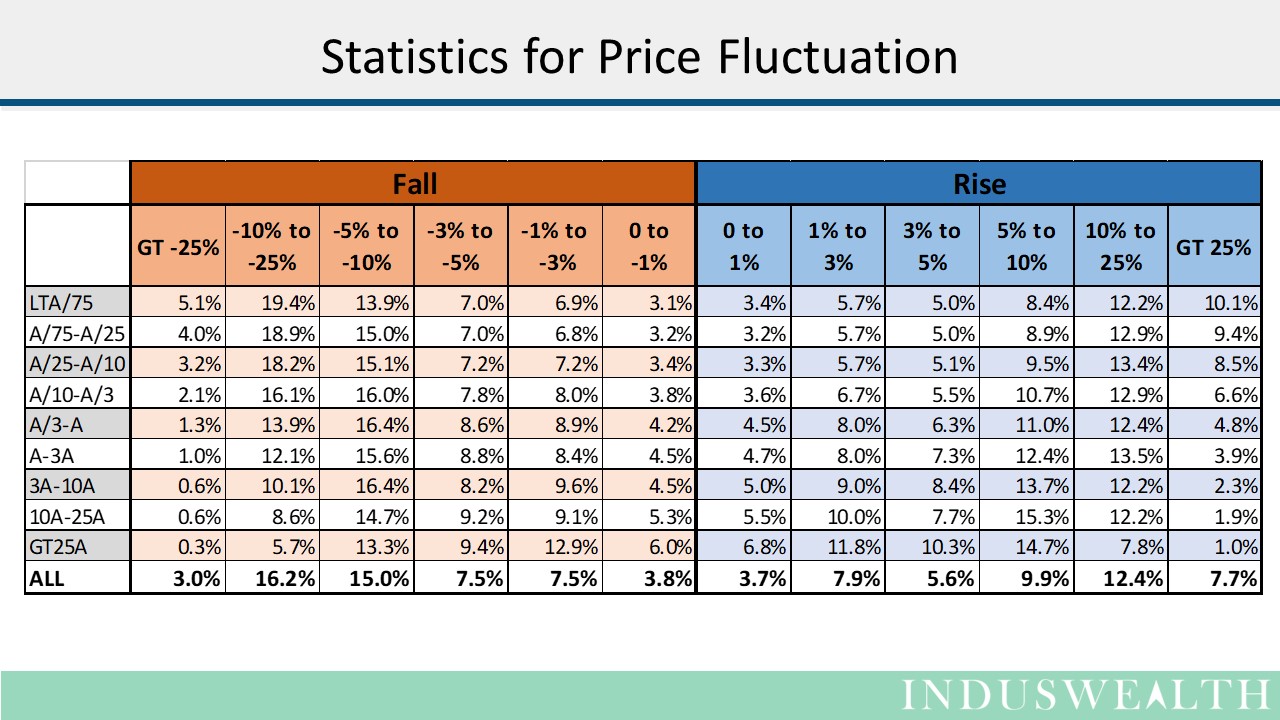
Observations from the chart above:
- Companies experience significant amount of fluctuation in their prices.
- Chance of monthly fluctuation of 1% or less is 6% to 13%, i.e., there is 87% to 95% chance that monthly fluctuation is more than 1%
- Chance of monthly fluctuation of 3% or less is 19% to 37%, i.e., there is 63% to 81% chance that monthly fluctuation is more than 3%
- Chance of monthly fluctuation of 5% or less is 31% to 57%, i.e., there is 43% to 69% chance that monthly fluctuation is more than 5%
- Chance of monthly fluctuation of 10% or less is 53% to 85%, i.e., there is 15% to 47% chance that monthly fluctuation is more than 10%
- Chance of monthly fluctuation of 10% or less is 53% to 85%, i.e., there is 15% to 47% chance that monthly fluctuation is more than 10%
- Chance of monthly fluctuation of 25% or less is 85% to 98%, i.e., there is 2% to 15% chance that monthly fluctuation is more than 25%
Inference from the analysis
- Volatility is the norm and not an exception
- As a group smaller companies tend to have greater amount of volatility
Even the bluest of blue companies have experienced significant volatility. Here is the link for the list of companies and their fluctuation stats for the last 18 years.
This is the link to an article we published about daily volatility in the market.
In conclusion we can say that volatility is a feature of the equity market. Most people do not like volatility hence avoid being long term equity investors. Therefore, equity returns are better in the long-term. If volatility in the equity markets decreases, then it will attract more investors and capital thus reducing the overall return to investors.
Equities give better returns to investors is because of their volatility not despite their volatility.
Happy Investing….