This article is analysis of P/E ratio of NIFTY from Jan-2001 to 21 Sept 2018.
Let’s start with the basics:
P/E ratio – is a ratio of price to earnings.
In simple terms, if a company is making a yearly profit of Rs 1,000 and then what would an investor pay to buy the company. If the investor is ready to pay Rs 10,000 then the P/E is 10, i.e., investor is paying 10 times the current earnings to own the company. If the investor is ready to pay Rs 20,000 then the P/E is 20, i.e., investor is paying 20 times the current earnings to own the company.
For a buyer it is always better to pay less – If the P/E is high that means the valuations are rich (it is costly to buy) and if the P/E is low that means that the valuations are attractive (it is less expensive to buy).
P/E of the Index is the market value of the companies that constitute the index divided by the earnings of those companies.
Data about data:
- Daily P/E data from 01-Jan-2001 to 12-Sep-2018 has been analyzed (source of data NSE website).
- Tabulated the monthly averages for the P/E for each of these years.
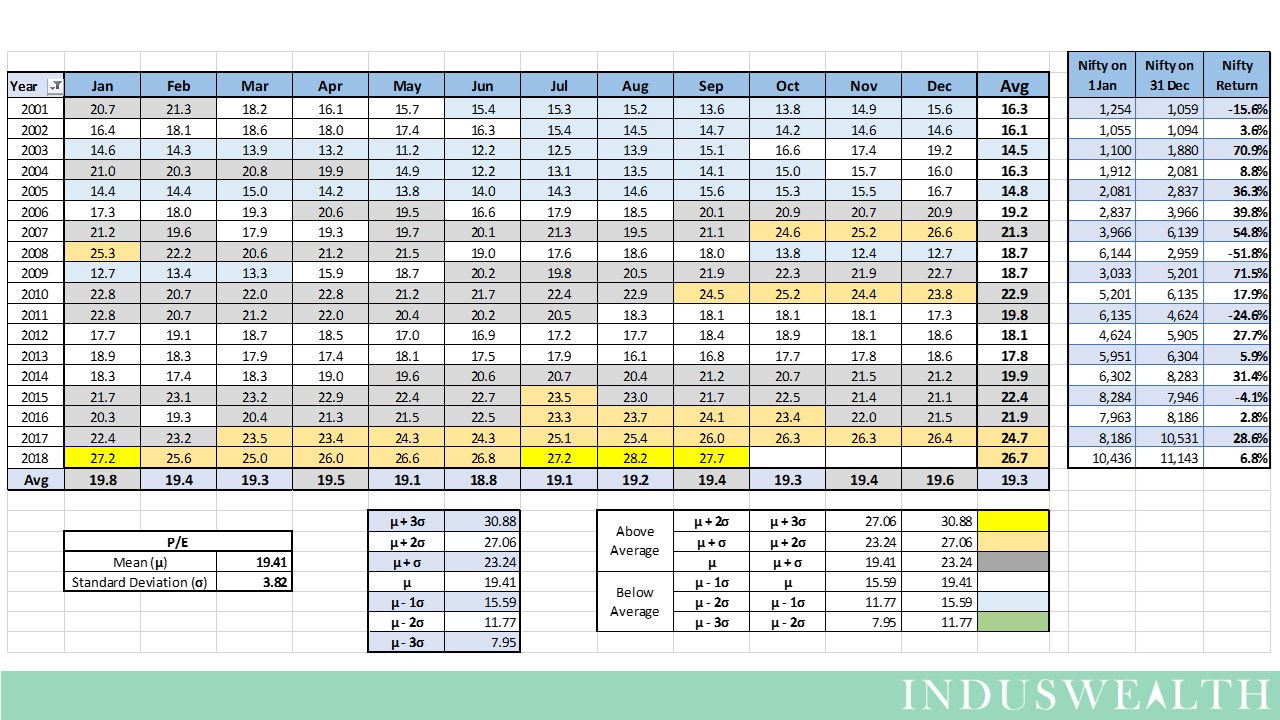
Observations from the chart above:
- Average daily P/E for the last 18 years has been 19.41
- The standard deviation of P/E has been 3.82
- Starting May 2014, the market P/E has been consistently above average (except for one-month Feb 2016).
- Starting March 2017 P/E has been more 23.24, i.e., more than one standard deviation from mean
- In 2018 P/E has been more 27.06 for 4 months, i.e., more than two standard deviation from mean
- Starting Sep 2017, P/E h as been above 26 (but for just 2 months Feb-18 and March 18)
Inferences that can be drawn for the above analysis:
NIFTY has never sustained such long periods of high P/E’s without significant corrections as it has done since May 2014.
Happy Investing….