As we end the financial year 2015-16, we are happy to share the results of IndusWealth model portfolio.
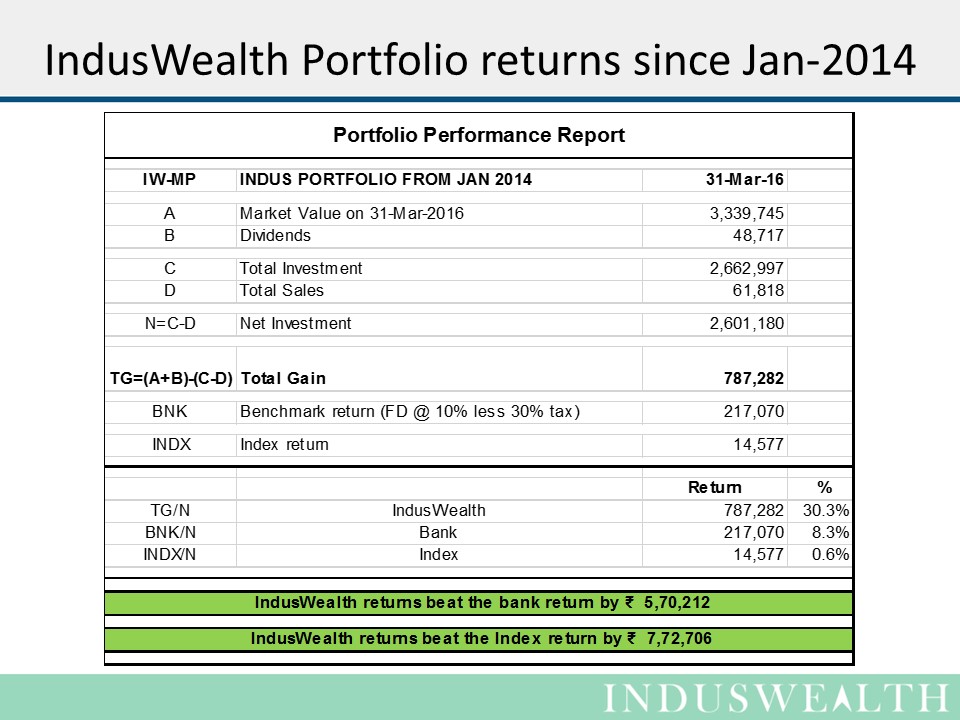
- Investing Rs 1 lakh a month since Jan 2014 in the IndusWealth portfolio would have gain of Rs 7,87,282.
- The same funds in invested in NIFTY would have a gain of Rs 14,577 or an opportunity loss of 7,72,706.
- If this money was invested in a Bank FD it would have a gain (interest) of 2,17,070 or an opportunity loss of 5,70,212.
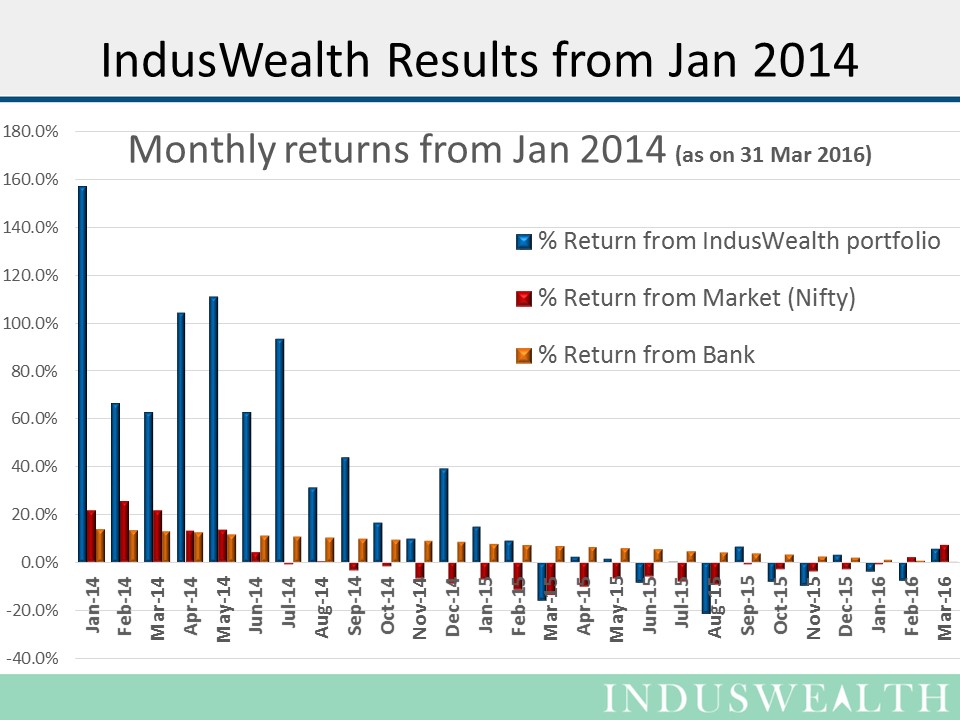
- IndusWealth portfolio has beaten the markets in 19 of the last 27 months.
- NIFTY has lost money in 18 of the last 27 months
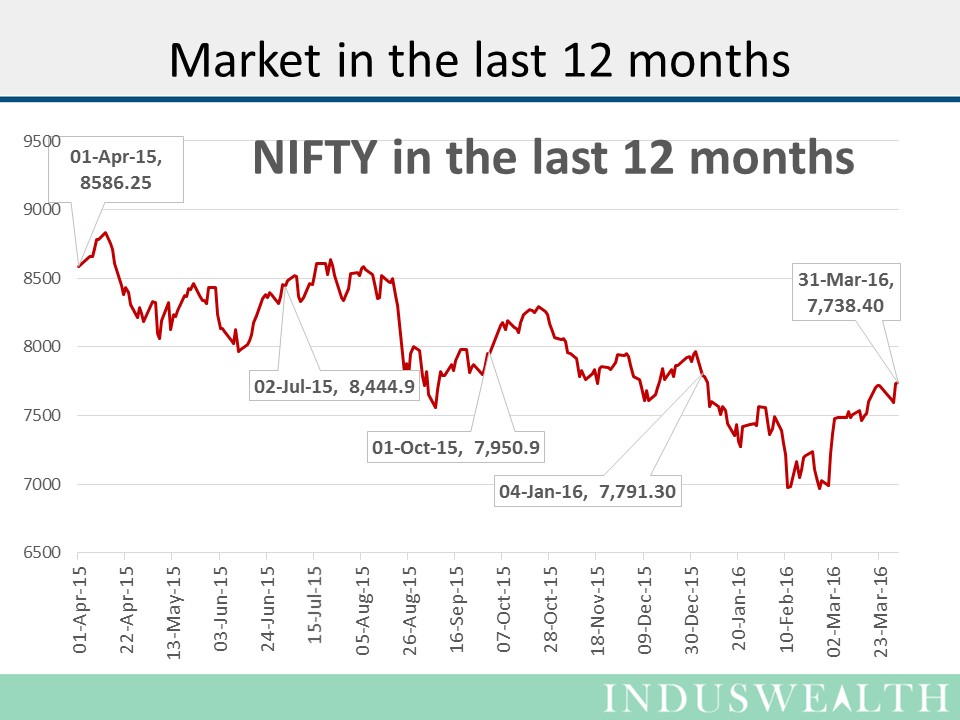
Over the last 12 months markets fell from 8590 to 7,740 – about 10% fall.
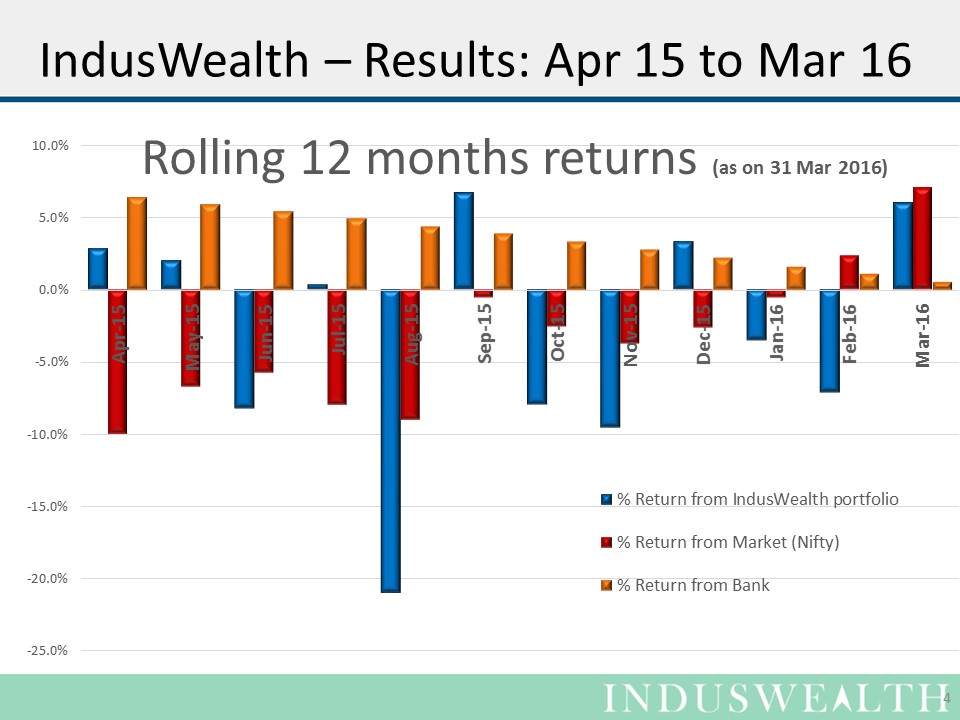
Over the last 12 months (April-15 to March-15), Investing monthly in Nifty one would have lost 3.3%, similar investment in IndusWealth Portfolio has lost 3%, beating NIFTY by 0.3%
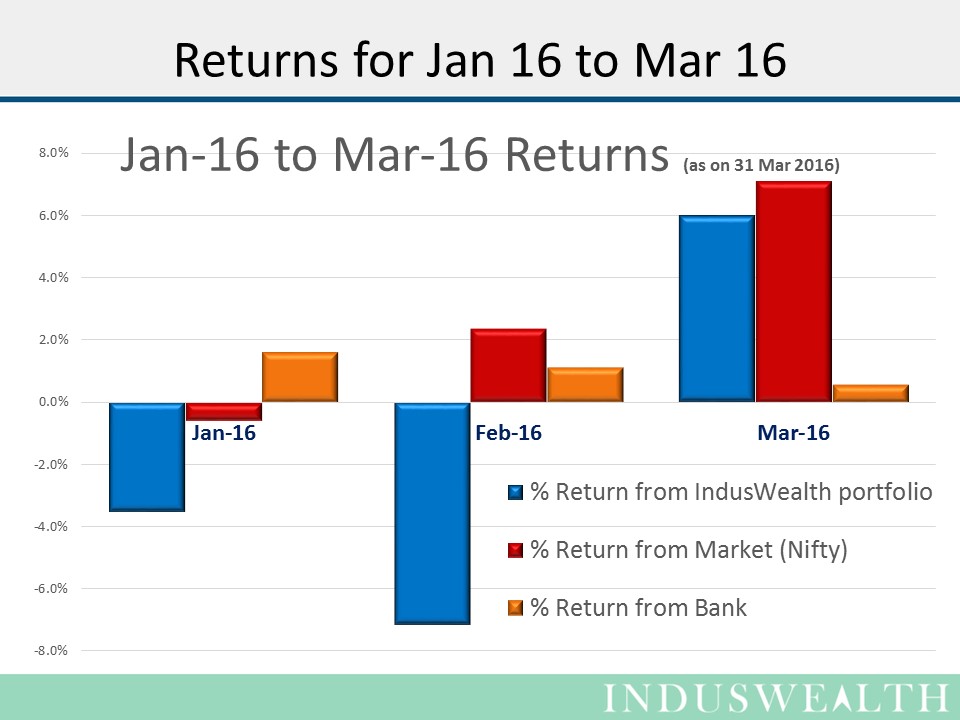
- Investing in NIFTY over the last quarter one would have gained 3%, IndusWealth Portfolio in the same period has lost 1.6%, thus trailing NIFTY by 4.6%
IndusWealth tracks and reports each month’s investments independently. Over the last 27 months, IndusWealth has beaten the market in 19 months. In the last 27 months investments were made in 80 stocks of which 49 are beating Nifty.
In summary – long-term investments continue to do well, while shorter term performance has been volatile.
Results for IndusWealth can be downloaded from the links below:
- Summary of the returns
- Portfolio performance summary
- Benchmark retrun calculations
- Transactions in the model portfolio
- Stock wise returns for the model portfolio
Market Outlook
P/E of the market continues to be slightly above 20, thus making it fairly expensive. One can reasonably expect earnings to improve as many of the companies have started to report better results. Although India story continues to be attractive, with elections in 5 states and bit of global turmoil, we could be in for prolonged periods of sideward movements with a negative bias.
We continue to reiterate that these markets are conducive for long term investors who feel comfortable dealing with the volatility in the short term. We believe that disciplined investors will do well by investing in good companies that are attractively valued and holding them for a long period of time.