As investors we want to make money, but that in itself is not a well stated goal. Returns generated should be better than the opportunity cost faced by the investors. Also, the returns need to be compared with an appropriate index to see if one should be a passive investor or an active investor.
This articles is an excerpt from a white paper that is looking at the chances of generating returns better than opportunity of cost for holding periods of 1,2, & 3 years. This analysis assumes an opportunity cost of 12% per year (1% per month).
Rationale being that one should be looking to invest in equities only when the returns are better than the opportunity cost.
This analysis is looking at 2 variables
- Market valuation – P/E levels of the market when the investment is being made
- Size (market capitalization) of the company with respect to the average
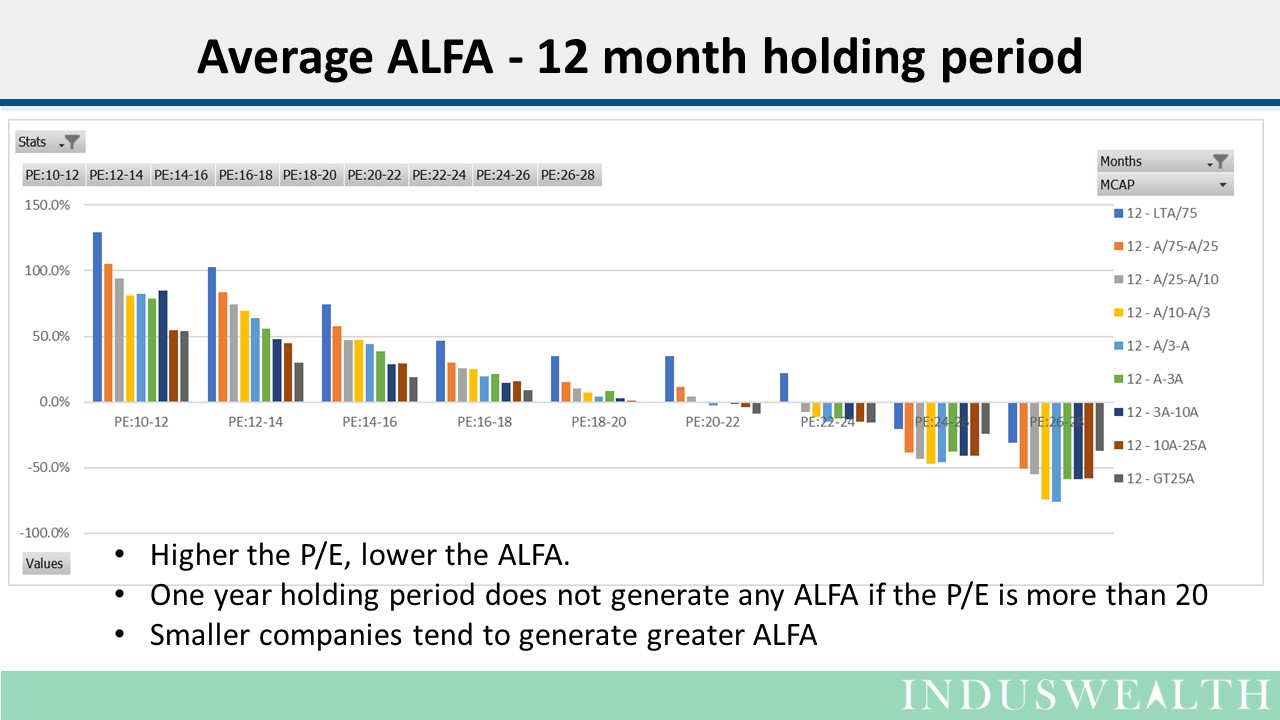
For this excerpt, we define ALFA as Average “above bank return” (average of returns from equity less the opportunity cost of 1% per month)
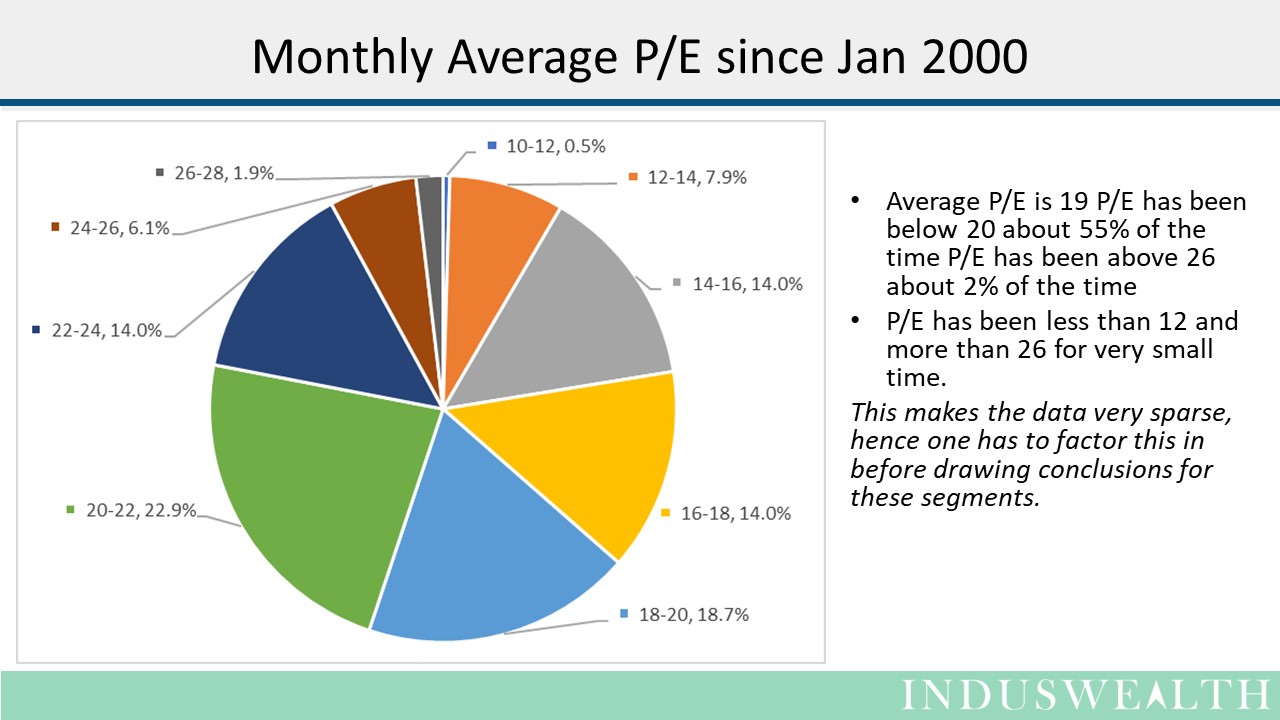
The chart below depicts the P/E levels since Jan 2000. P/E levels (average P/E for the month), have been categorized into various groups 10-12, 12-14,…..,26-28
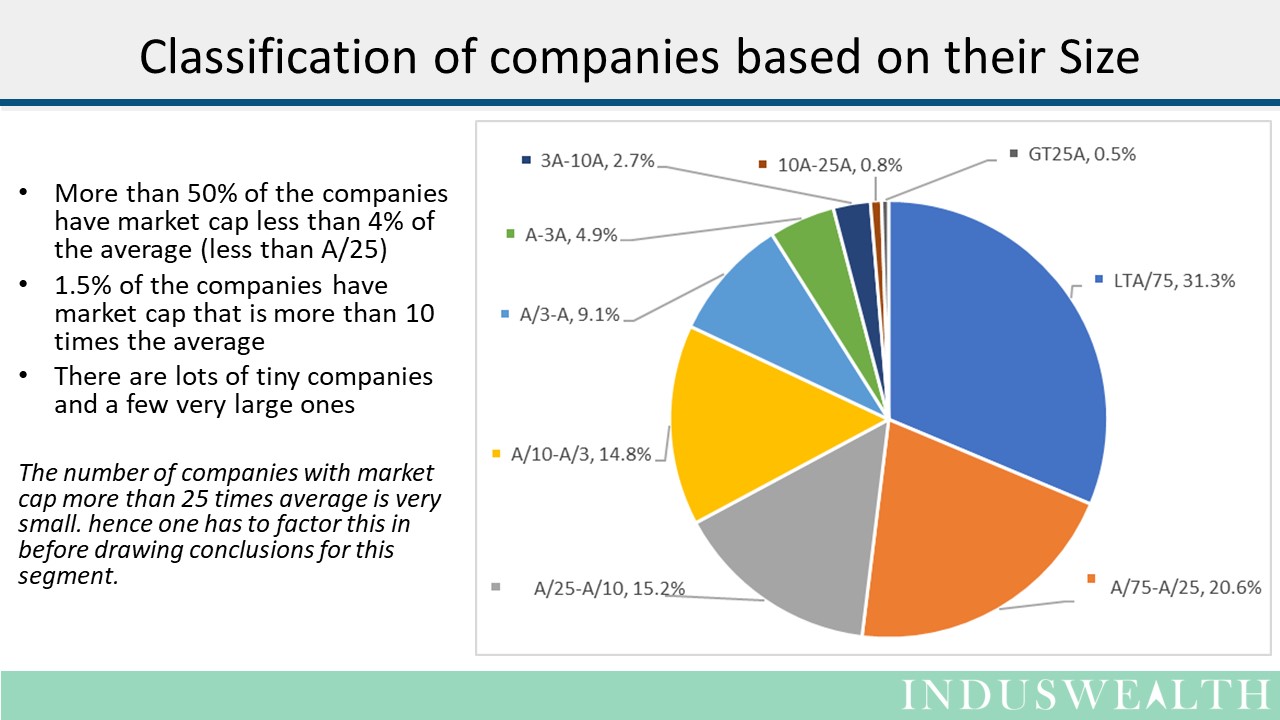
To analyze the companies by their size, they have been categorized based on the their relative market capitalization (relative to average market cap for the year).
9 categories have been created (“A” represent average market cap for the respective year), this allows comparison of companies across years.
- Category “A-3A” represents all companies whose market cap is between the average and 3 times average
- Category “A/3-3A” represents all companies whose market cap is between one third of average and average
- Category “LTA/75” is companies whose market cap is less than 1/75 of the average company
- Category “GT25A” is companies whose market cap is more than 25 times the average company
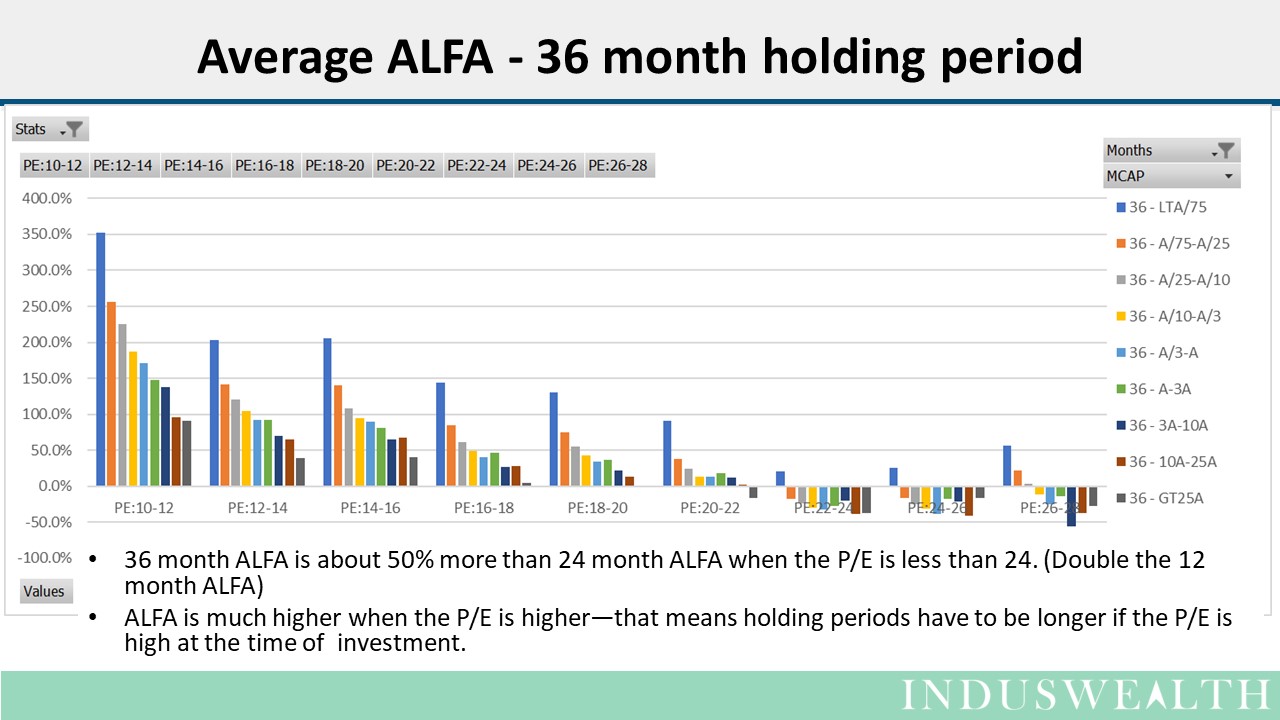
Conclusions that can be drawn from the above analysis
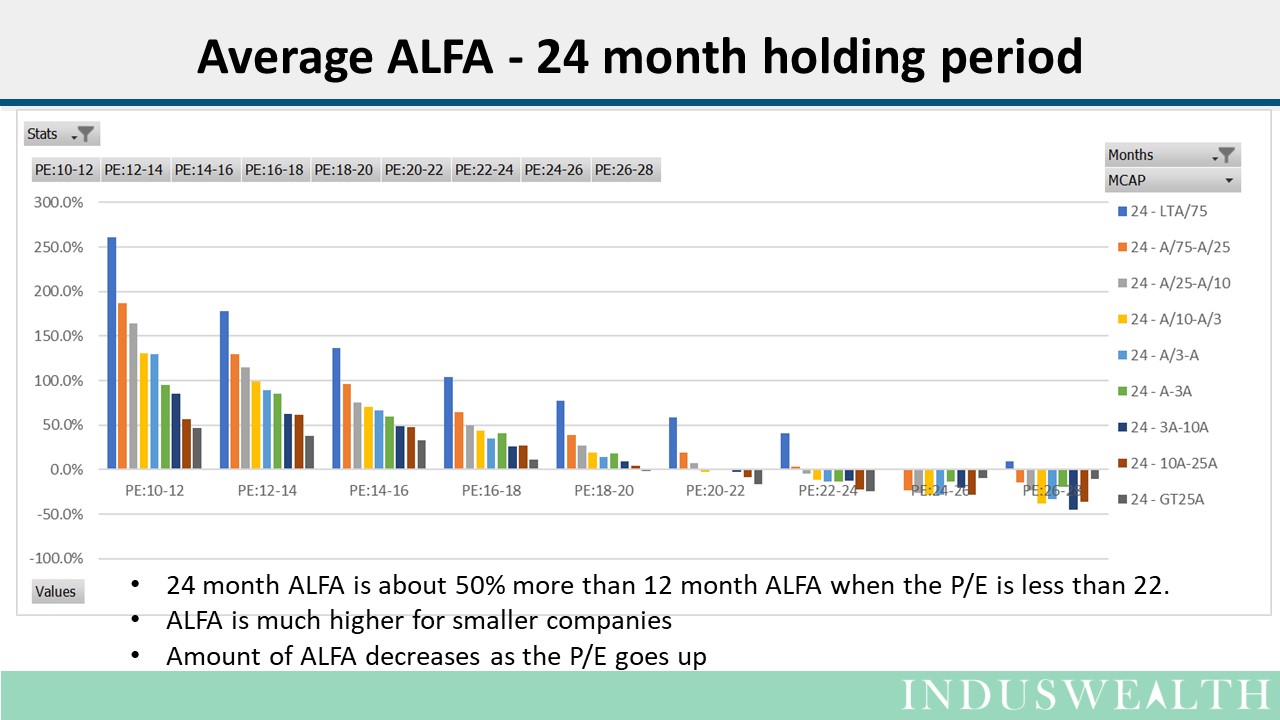
- Investments made when the P/E is high will need longer holding periods (3 years if the P/E is above 24).
- Odds of generating ALFA increase when the holding period is longer
- Companies with market capitalization between 10% of average to 3 times the average (A/10-3A) represent 30% of all the companies available in the investment universe and could be a viable set to look for decent investment opportunities.
- Companies with below average market capitalization can be considered when the market P/E levels are low (below average)
- At higher P/E levels (above average) companies with above average market capitalization could be considered
Click here to download the whitepaper
Happy Investing….